from superagentx.visualization import Visualize
async def visualize_handler():
obj = Visualize()
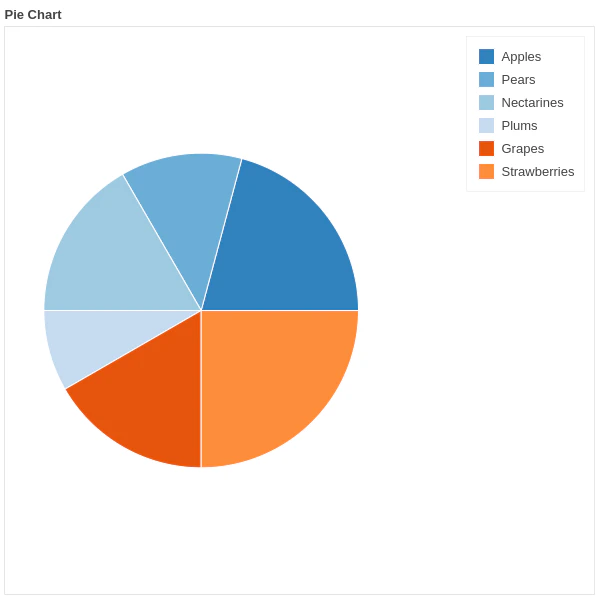
chart_data = [
{
"Apples": 5,
"Pears": 3,
"Nectarines": 4,
"Plums": 2
"Grapes": 4,
"Strawberries": 6
},
{
"Apples": 12,
"Pears": 42,
"Nectarines": 1,
"Plums": 51,
"Grapes": 9,
"Strawberries": 21
}
]
await obj.pie_chart(data=chart_data, show_output=True)